Top States That Benefit the Most from Marijuana Legalization
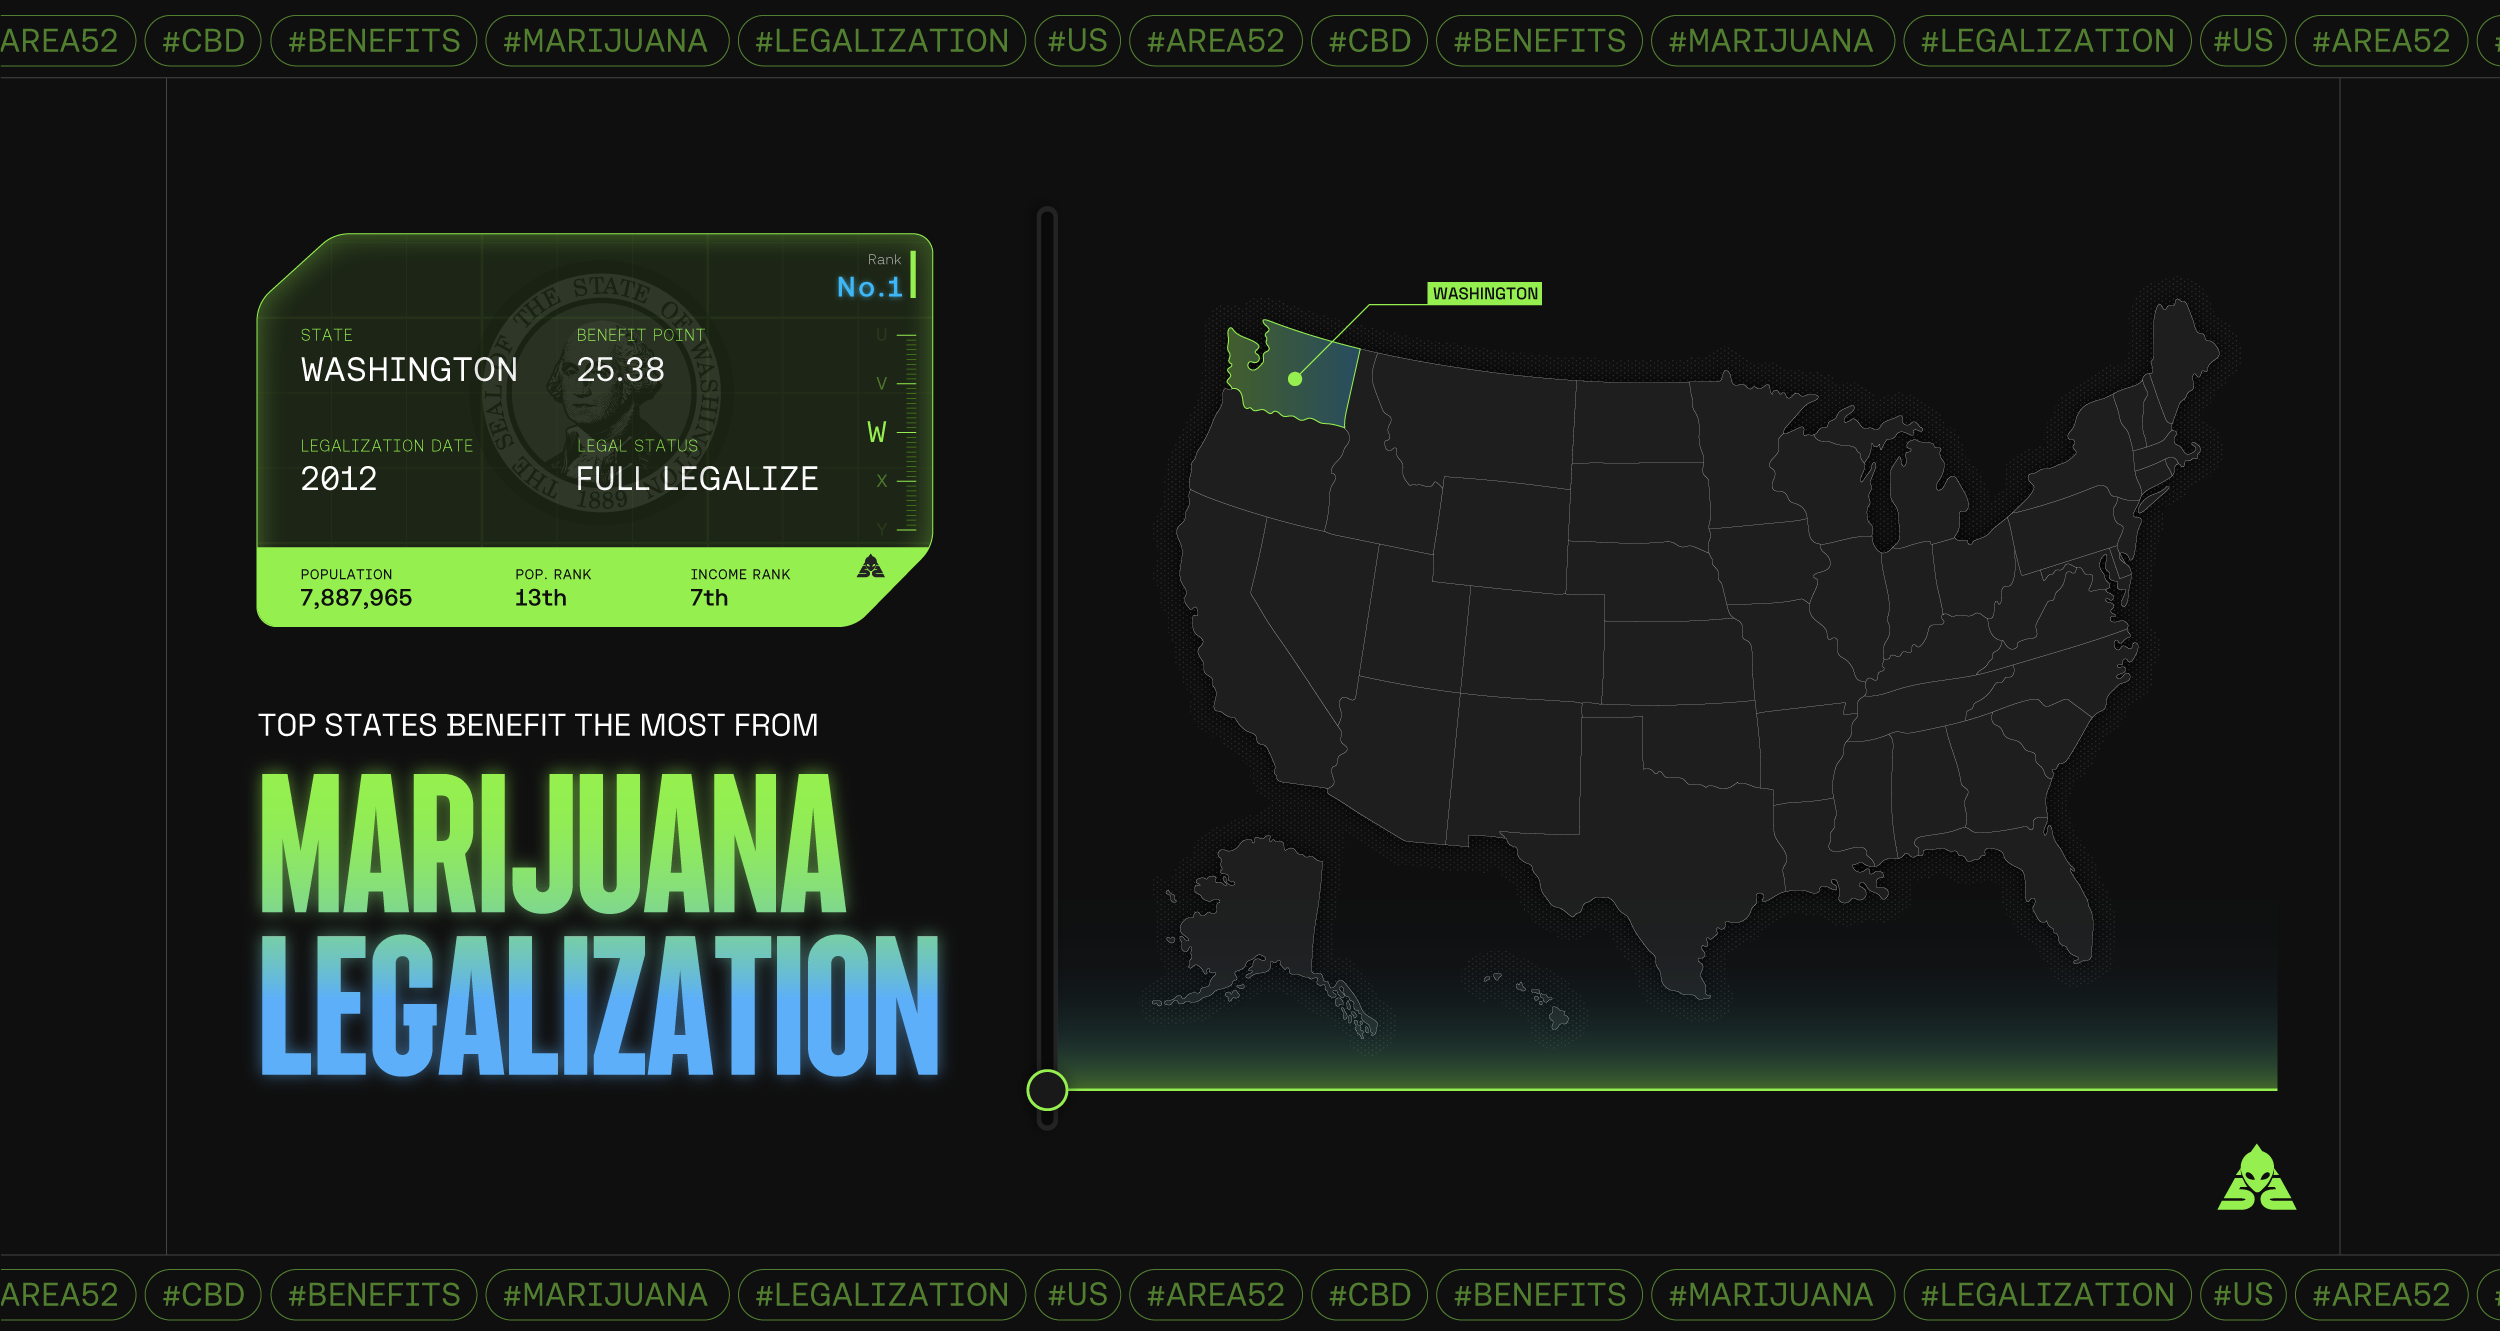
Marijuana has its benefits, which explains why some states have legalized the retail sales and consumption of the drug, may it be for recreational cannabis or medical marijuana use. But are these benefits tangible? Can states with laws enabling the free use and trade of weed claim they have attained benefits from their reformed marijuana legislation?
We sought the answers to these questions by studying the top states that benefit the most from marijuana legalization. Our study analyzed the economic and health benefits of the mentioned states, and the overall impact that marijuana legalization has on the U.S. Here’s what we unearthed.
How Did We Do?
We use eight parameters to rank the extent of recreational marijuana legalization’s advantages and the impact of state medical marijuana legislation. Equal weight is assigned to each metric. We gathered and analyzed data from various government websites. The extent of benefits brought by legal cannabis is denoted by a “benefit point” assigned to each state. Please refer to our thorough methodology at the end of this article.
Key Findings
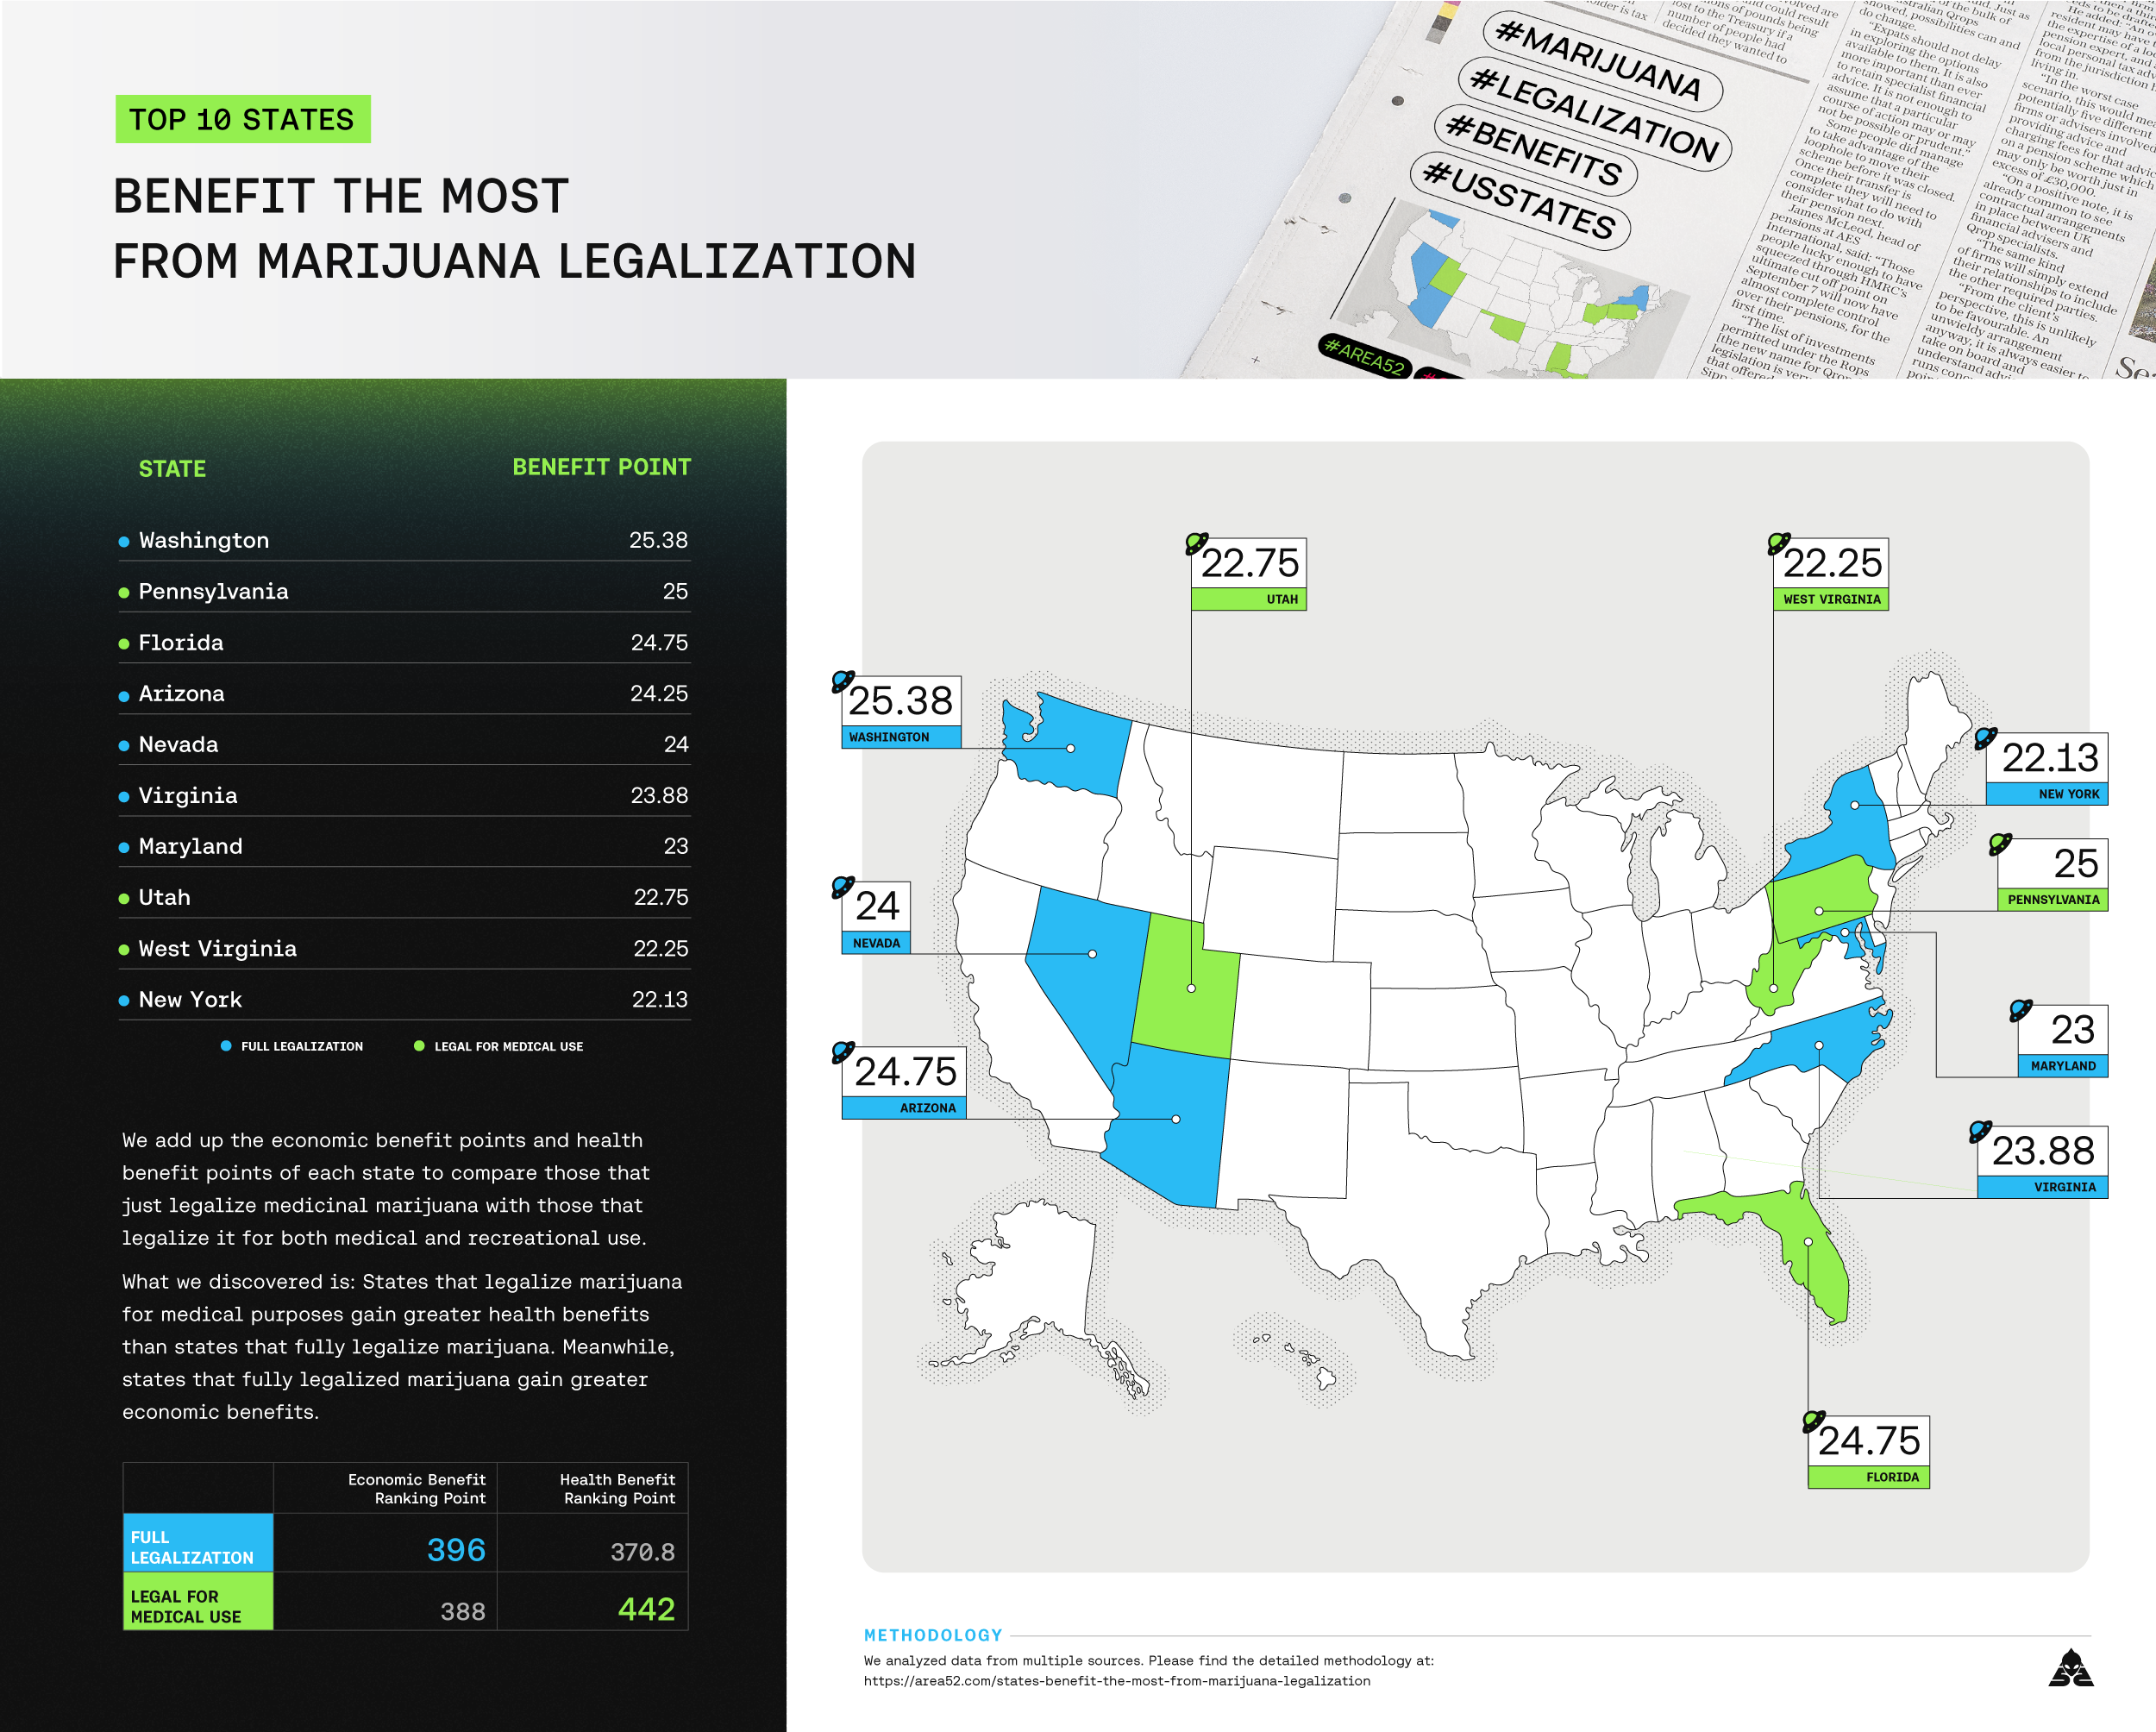
- Top 5 states that benefit the most from marijuana legalization:
- Washington
- Pennsylvania
- Florida
- Arizona
- Nevada
- States with medical cannabis laws gain greater health benefits than those that fully legalize it. Meanwhile, states that fully legalize recreational marijuana and also have state medical marijuana laws in place gain better economic benefits.
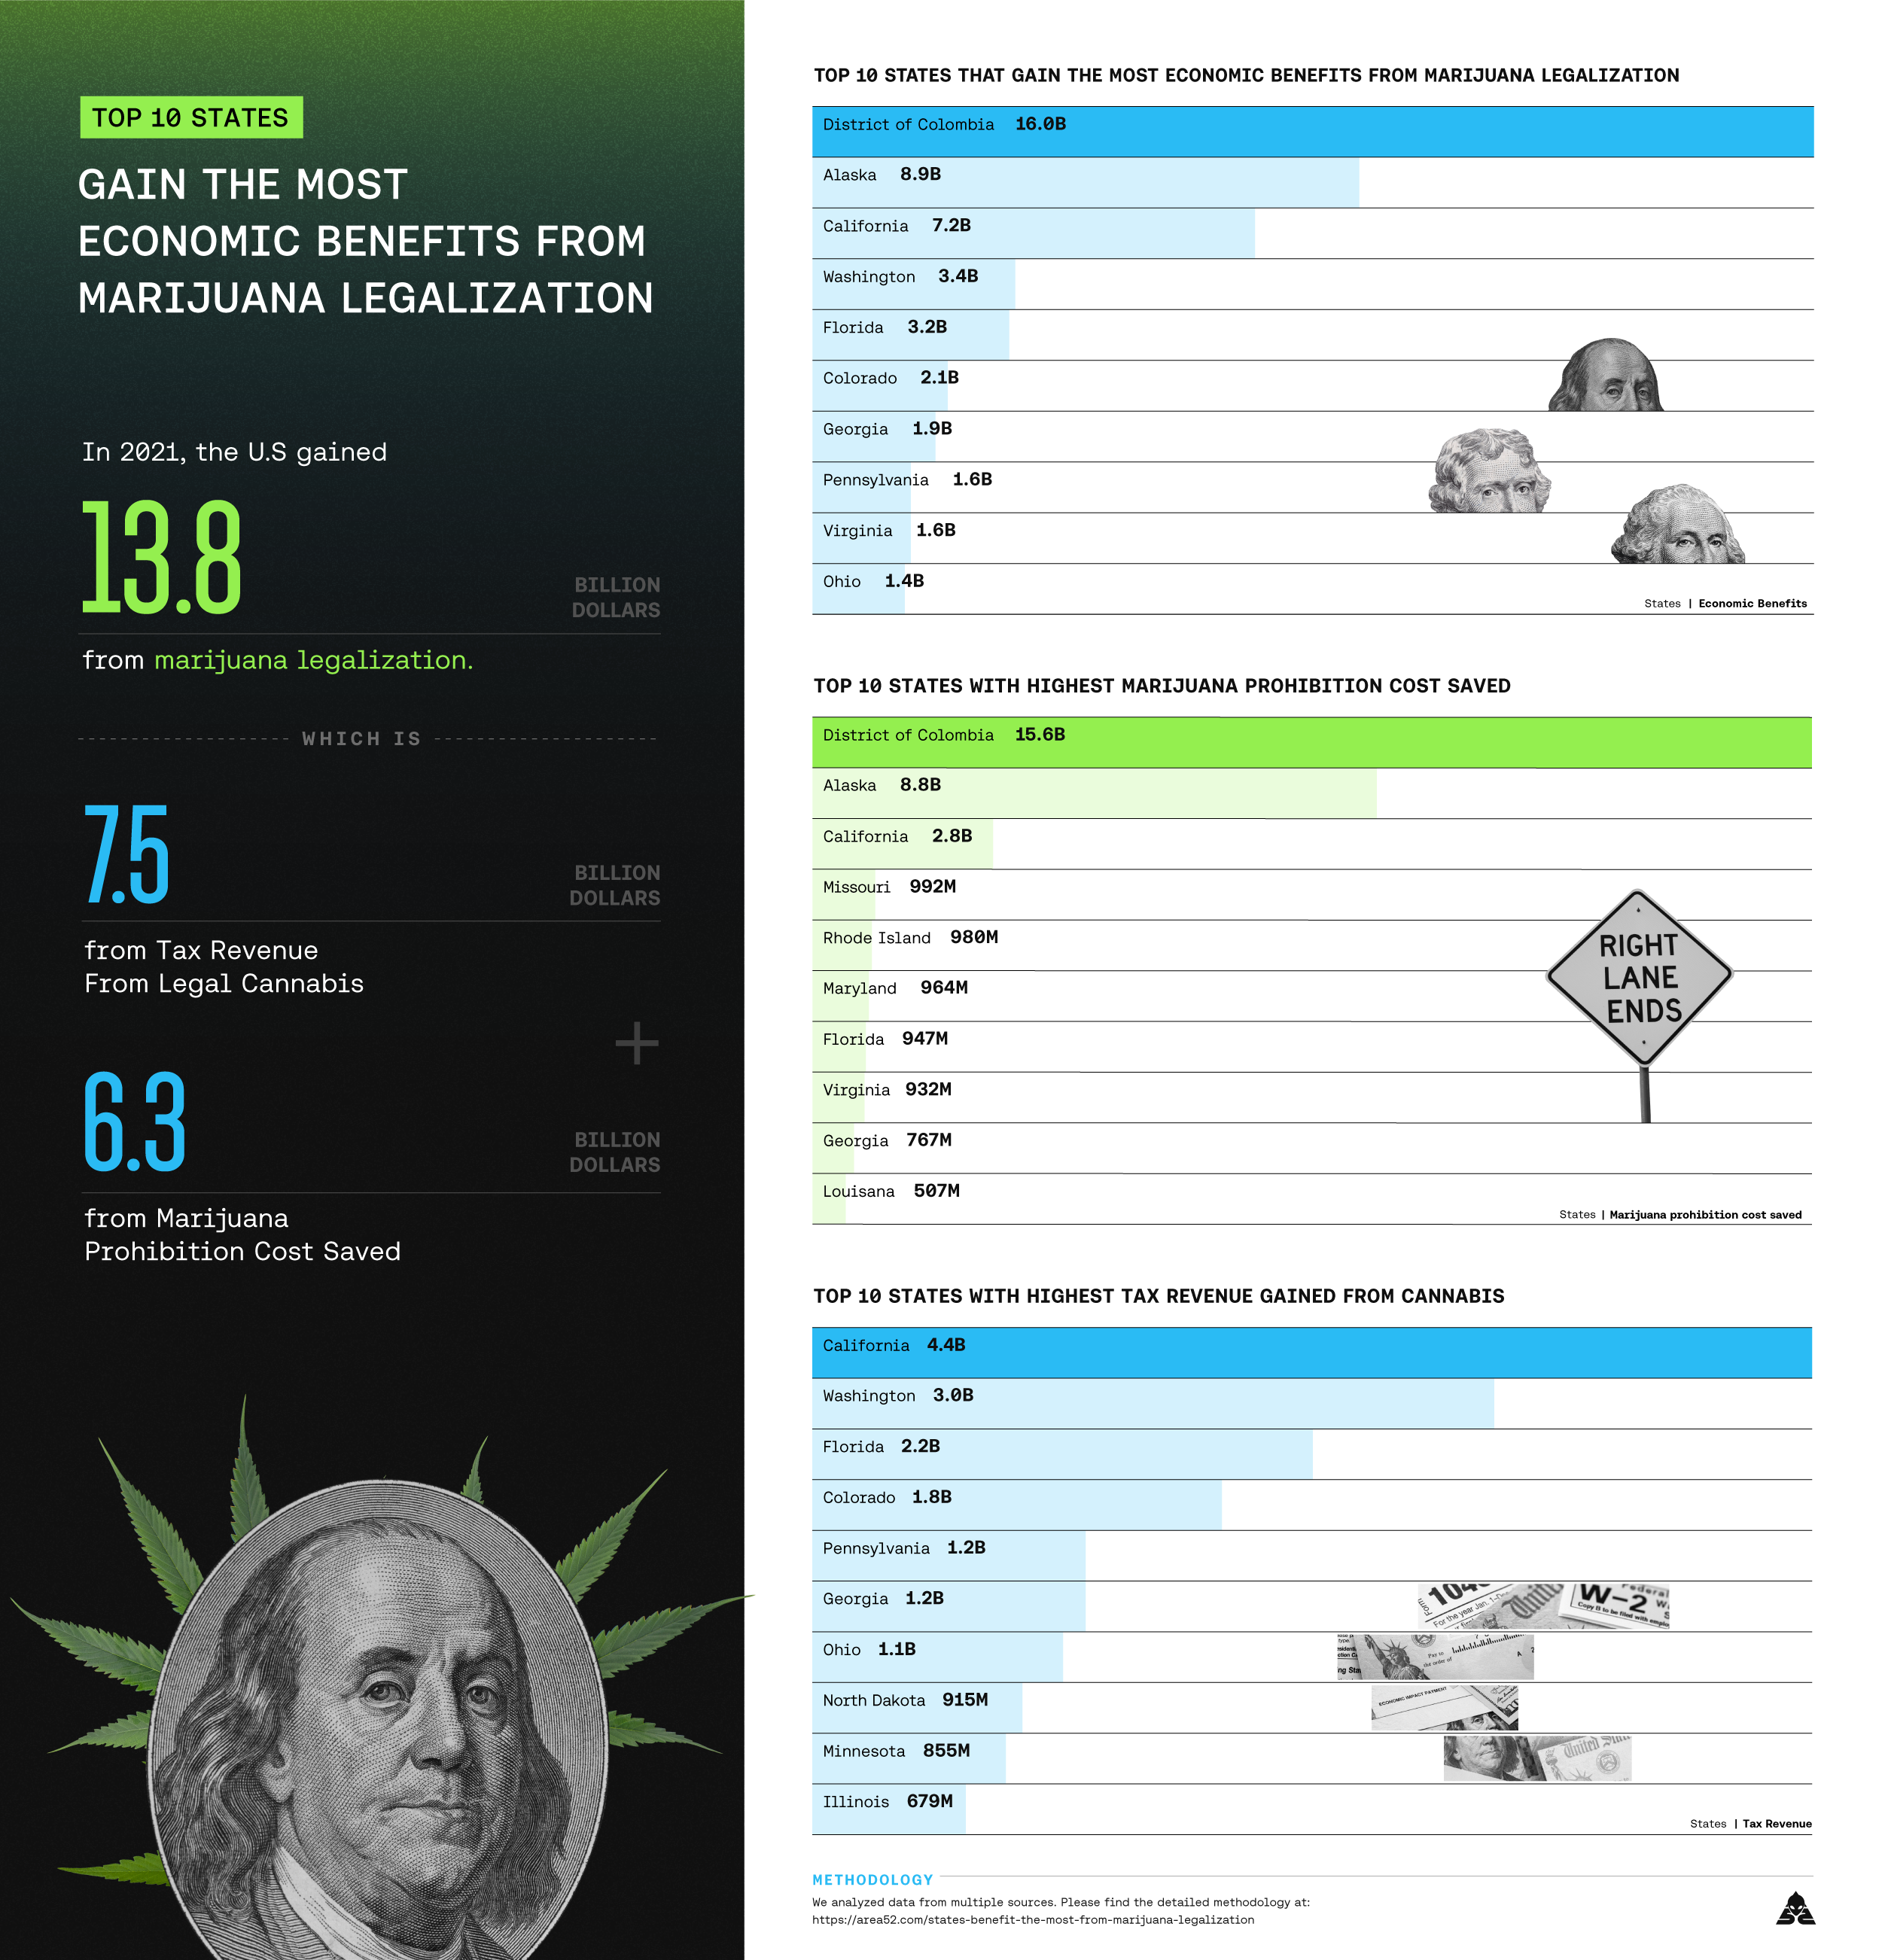
- Top 5 states benefiting the most economically from marijuana legalization
- District of Columbia
- Alaska
- California
- Washington
- Florida
- In 2021, the U.S. gained 13.8 billion dollars from marijuana legalization.
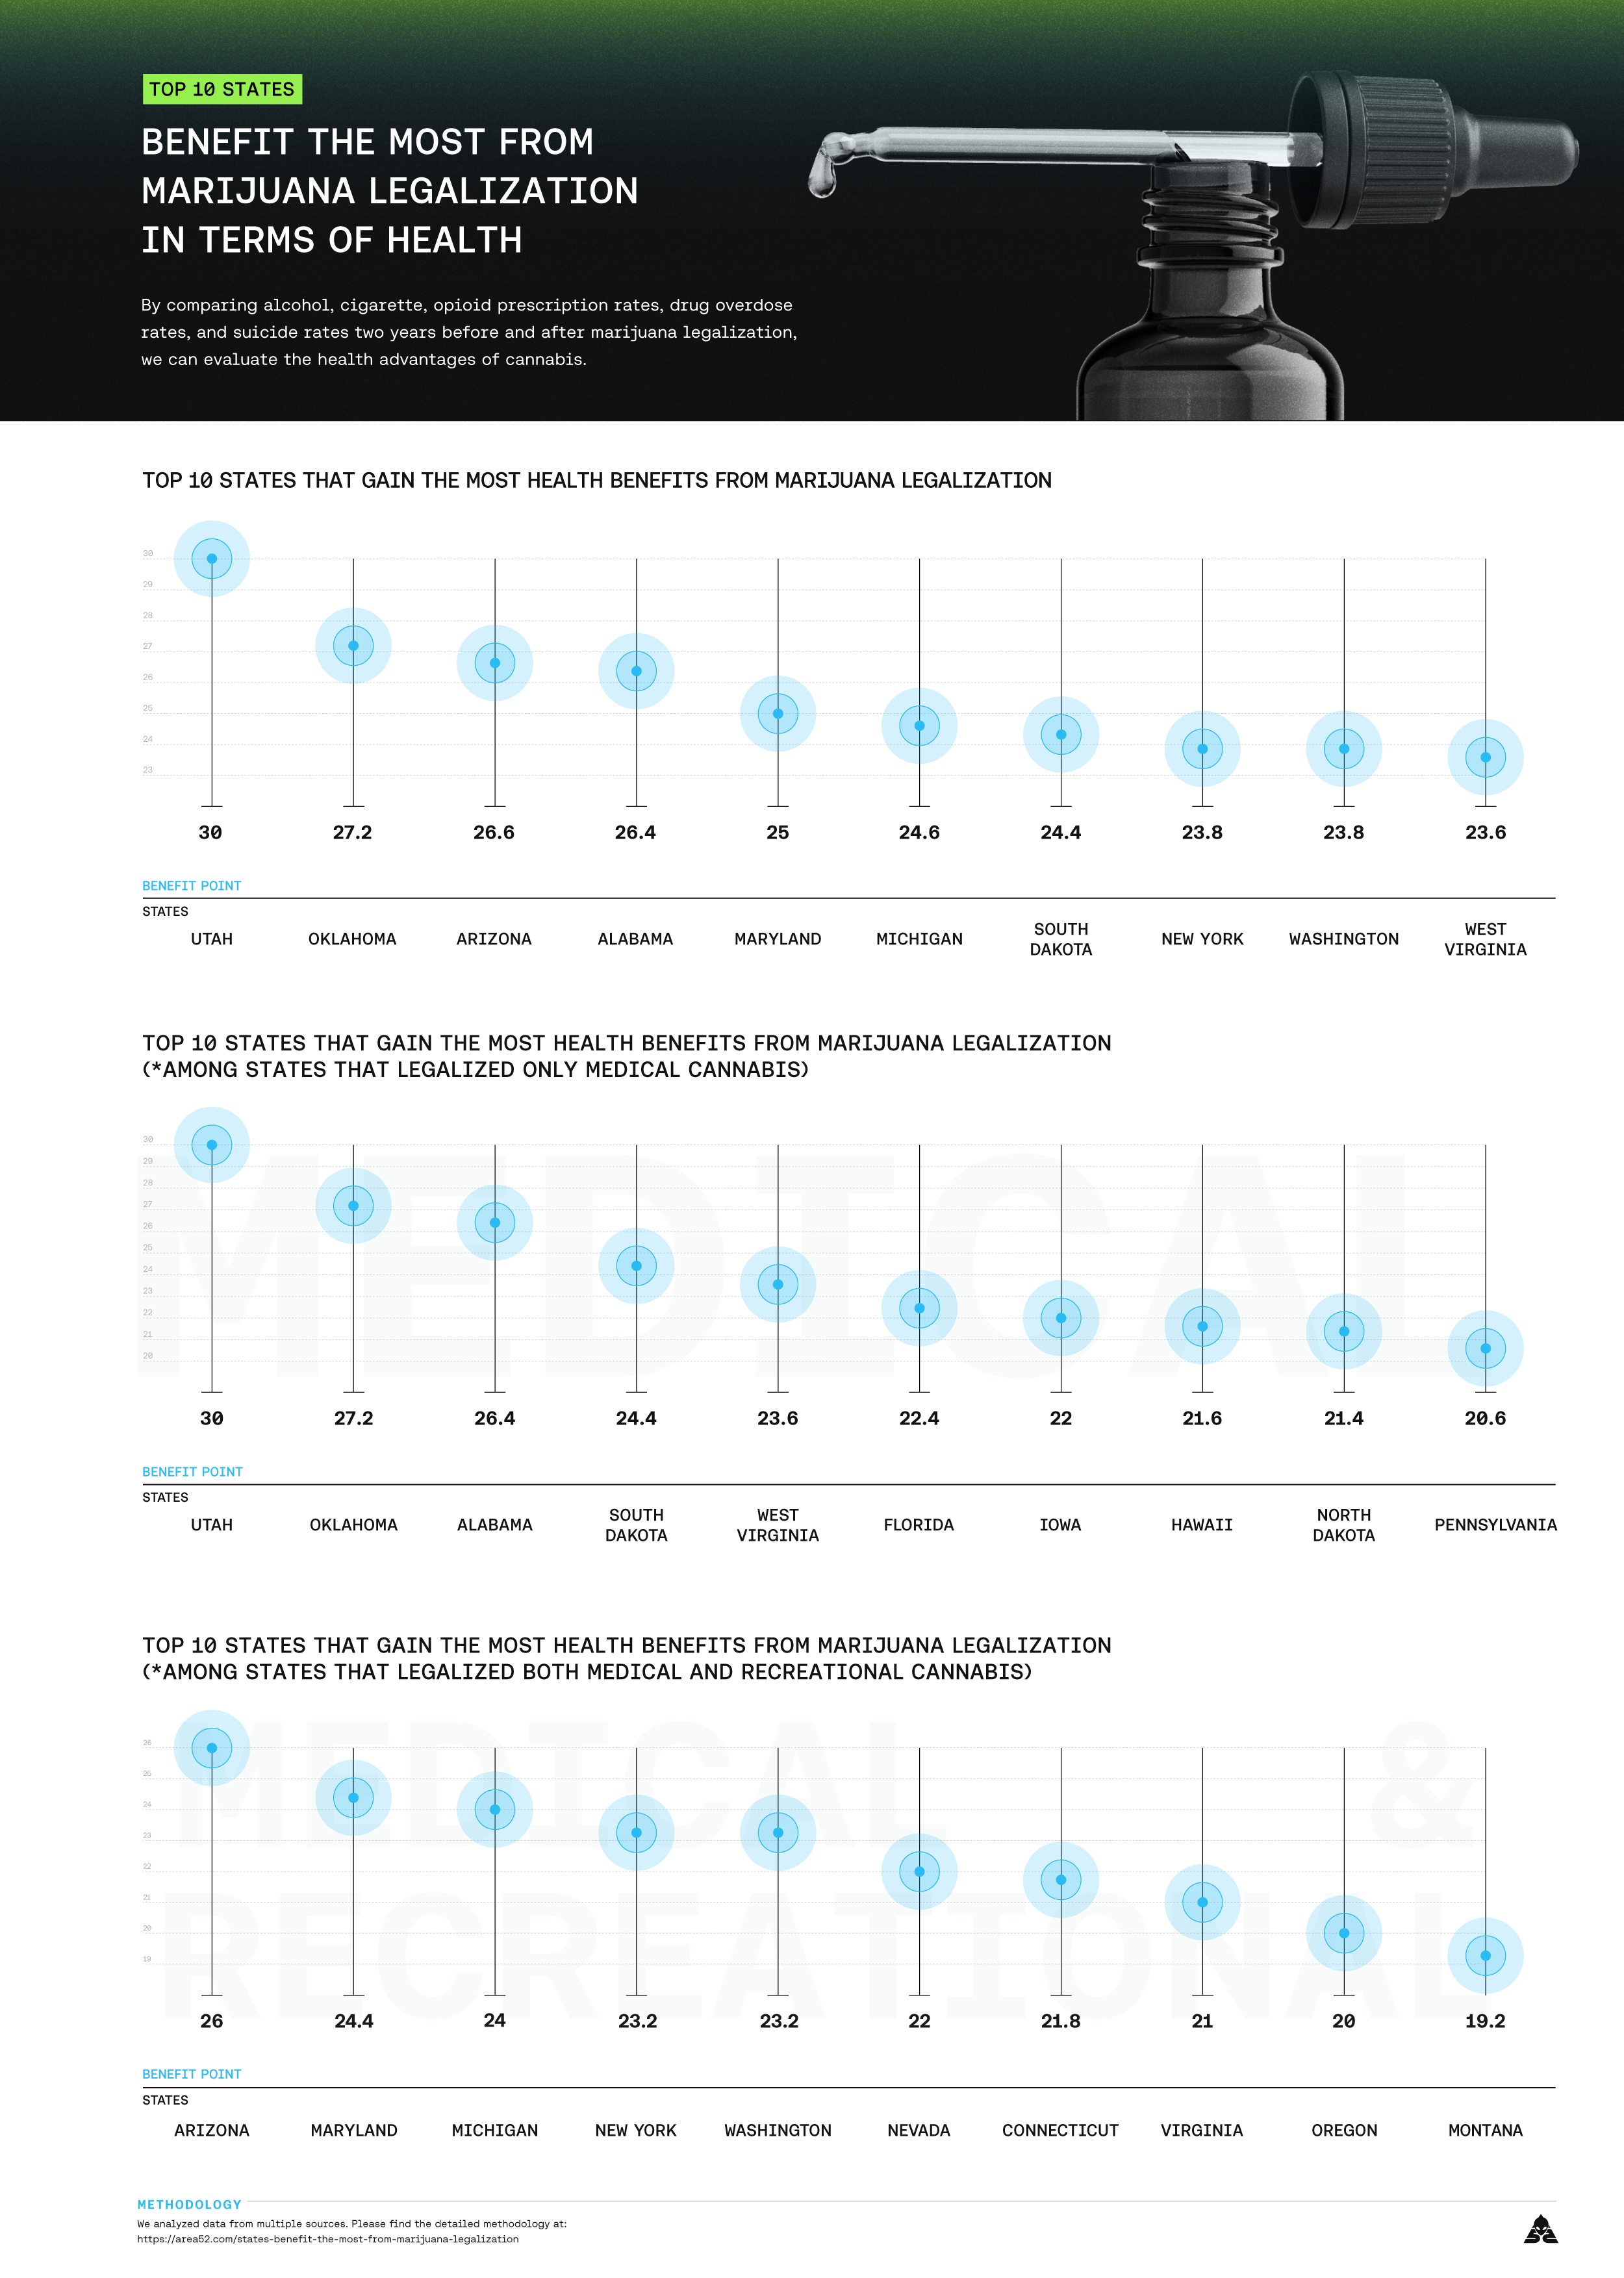
- Top 5 states that benefit the most from marijuana legalization in terms of health
- Utah
- Oklahoma
- Arizona
- Alabama
- Maryland
Top 10 States That Benefit The Most from Marijuana Legalization
Top 10 States That Gain The Most Economic Benefits from Marijuana Legalization
To assess economic benefits, we add up cannabis tax revenues and marijuana prohibition costs saved from marijuana legalization.
The marijuana prohibition cost is calculated based on the finding of this research by Jeffrey Miron – vice president for research at the Cato Institute: “legalizing marijuana would save $7.7 billion per year in government expenditure on enforcement of prohibition”. The average cost of law enforcement for each marijuana arrest is then calculated by dividing $7.7 billion by the annual number of U.S. marijuana arrests. Multiplying this amount by the total number of arrests made in each state during that given year yields the cost of marijuana law enforcement in the state prior to cannabis legalization. To estimate the cost savings from marijuana legalization, we employed the linear regression model.
Top 10 States That Benefit The Most from Marijuana Legalization in terms of Health
By comparing alcohol, cigarette, opioid prescription rates, drug overdose rates, and suicide rates two years before and after marijuana legalization, we can evaluate the health advantages of cannabis.
How Marijuana Legalization Has Changed the United States
After two years of legalization, the rates of alcohol consumption, tobacco consumption, and opioid dispensing all decreased significantly:
- Alcohol consumption rate fell from 2.54 to 2.53
- Tobacco consumption rate fell from 16.69 to 16.63
- Opioid dispensing rate fell from 63.40 to 55.41
Top 5 states with the greatest drop in alcohol consumption after two years of legalization
- South Dakota
- Alabama
- Maryland
- Arizona
- North Dakota
Top 5 states with the greatest drop in tobacco consumption after two years of legalization
- Nevada
- Maine
- Florida
- Georgia
- West Virginia
Top 5 states with the greatest drop in opioid dispensing after two years of legalization
- Oklahoma
- Ohio
- Maine
- Nevada
- Arkansas
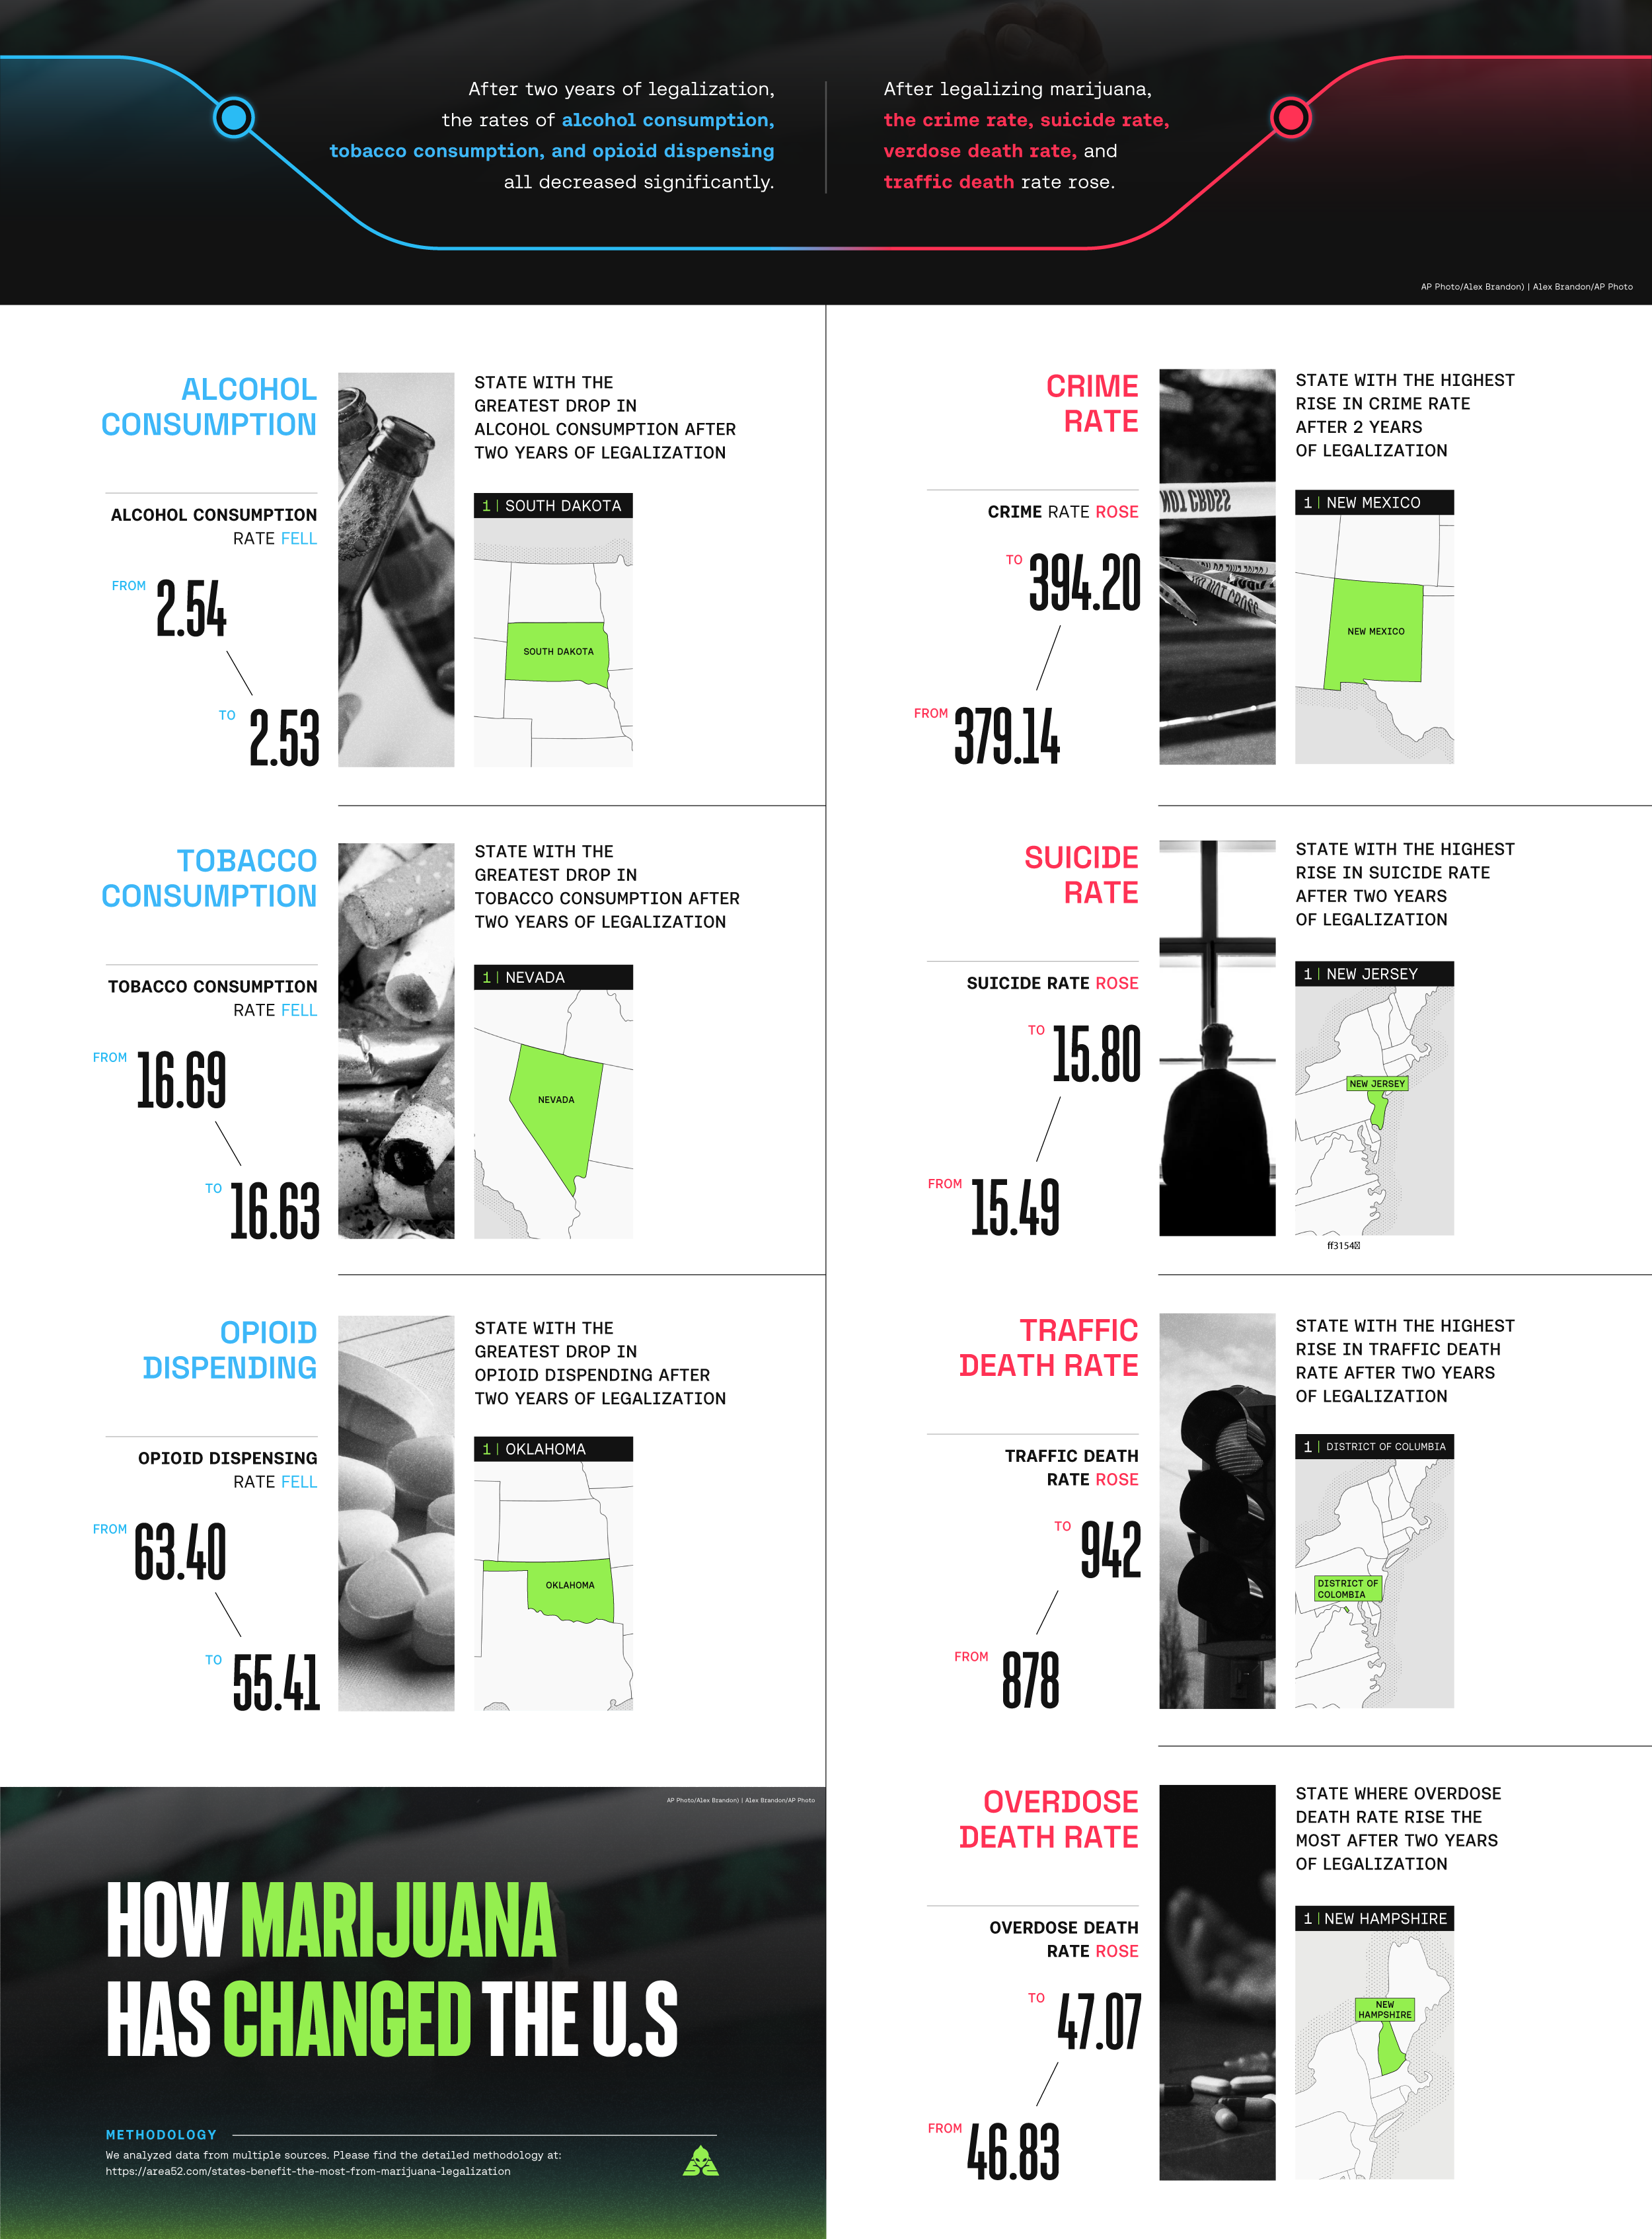
After legalizing marijuana, the crime rate, suicide rate, overdose death rate, and traffic death rate rose:
- Crime rate rose from 379.14 to 394.20
- Suicide rate rose from 15.49 to 15.80
- Overdose death rate rose from 46.83 to 47.07
- Traffic death rate rose from 878 to 942
Top 5 states with the highest rise in crime rate after 2 years of legalization
- New Mexico
- Montana
- Alaska
- Arizona
- Arkansas
Top 5 states with the highest rise in suicide rate after 2 years of legalization
- New Jersey
- Alaska
- New Hampshire
- Maine
- Oklahoma
Top 5 states where traffic death rate rise the most after 2 years of legalization
- District of Columbia
- Illinois
- Michigan
- Louisiana
- Georgia
Top 5 states where overdose death rate rise the most after 2 years of legalization
- New Hampshire
- Pennsylvania
- Illinois
- Ohio
- Maine
Methodology
The effects of marijuana legalization are ranked using eight metrics. Each metric is given an equal amount of weight.
Impacts on public health:
- Alcohol Consumption
- Drug Overdose
- Tobacco Consumption
- Opioid Dispensing
- Suicide Rate
Economic impacts
- Tax Revenue
- Marijuana Prohibition Cost Saved
Impacts on society in general
- Crime Rate
- Traffic Death Rate
First, to evaluate the degree of marijuana legalization benefit on each metric, we figure out how much a certain metric has changed over the course of two years before and after legalization. The “benefit point” of this metric is then determined by ranking this difference in descending order (this means the greater the benefit, the lower the ranking, the higher the point). The final “benefit point” for each state is calculated by averaging the “benefit points” of all measures.
Data Sources Used:
- Drug Overdose: cdc.gov
- Tax Revenue: mpp.org
- Traffic Death Rate: www-fars.nhtsa.dot.gov
- Alcohol Consumption: pubs.niaaa.nih.gov
- Crime Rate: cde.ucr.cjis.gov
- Tobacco Consumption: cdc.gov
- Opioid Dispensing: cdc.gov
- Suicide Rate: cdc.gov
- Marijuana Arrests: cde.ucr.cjis.gov
Limitations
Other factors that could influence the chosen metrics were not considered.
Missing data were replaced with the average value, and future unavailable data was forecasted using a three-period moving average.
Fair Use Statement
If you know someone who could benefit from our findings, feel free to share this report with them. The graphics and content are available for noncommercial reuse. All we ask is that you link back to this page so that readers get all the necessary information and our contributors receive proper credit.
*Complete data is available upon request
FAQ: Marijuana Legalization Benefits
Below are some of the commonly asked questions about marijuana legalization, its pros and cons as well as federal versus state laws.
1. Is Marijuana Scheduled Under Federal Law?
Marijuana is currently a Schedule I drug under federal law, which means it has no accepted medical use and carries a high risk for abuse [2]. It remains an illicit drug together with heroin, cocaine, MDMA, LSD, and peyote.
2. What is the Federal Legalization Bill for Marijuana?
There are several marijuana reform bills right now that aim to remove it from the Controlled Substances list and end its criminalization such as the HR 3617 or Marijuana Opportunity Reinvestment and Expungement (MORE) Act as well as the Cannabis Administration and Opportunity (CAO Act) [3]. HR 610, which was introduced in 2023, directs the Drug Enforcement Administration (DEA) to reclassify marijuana from a Schedule I to a Schedule III drug [1].
3. What Would Happen If Marijuana was Federally Legalized?
Federal legalization will allow researchers to fully study marijuana, especially non-psychoactive cannabidiol, without research blockades. It also has economic benefits, from creating more jobs to higher tax revenues. Even if the government were to legalize medical marijuana only, registered medical cannabis patients could benefit from safer access to quality cannabis products, reduced stigma to its use, and improved quality of life.
4. What are the Benefits of Legalization of Marijuana?
Marijuana legalization offers many advantages, from health to economic benefits. Research studies have shown that the cannabinoids found in the plant have many medical applications that could help with pain, inflammation, cancer, epilepsy, depression, and anxiety, among others. It can also create new industries as well as more jobs, higher cannabis sales, and investment opportunities. Its legalization will not only ease the burden on the legal and penal systems but also weaken the illegal black market as well.
5. What are Two Drawbacks to Marijuana Legalization?
Of course, legalizing cannabis has drawbacks as well. According to the Substance Abuse and Mental Health Services Administration, increased access can lead to higher addiction rates, especially among youths, as well as cause a spike in mental health issues associated with prolonged heavy use [4]. Other effects of legalization include fatal motor vehicle crashes due to driving under the influence, and problems in the workplace.
References:
- Congress.gov. . (2023). H.R.610 – Marijuana 1-to-3 Act of 2023. U.S. Congress. Retrieved March 18, 2025, from https://www.congress.gov/bill/118th-congress/house-bill/610
- Drug scheduling. (n.d.). DEA. https://www.dea.gov/drug-information/drug-scheduling
- Project, M. P. (n.d.). Current marijuana bills before Congress. MPP. https://www.mpp.org/policy/federal/current-marijuana-bills-before-congress/
The effects, risks and side effects of marijuana (Weed, cannabis, THC). (n.d.). SAMHSA. https://www.samhsa.gov/substance-use/learn/marijuana/risks


